准备工作
#安装必要的R包
options("repos" = c(CRAN="http://mirrors.tuna.tsinghua.edu.cn/CRAN/"))
if(!require(tidyr))install.packages("tidyr",update = F,ask = F)
if(!require(dplyr))install.packages("dplyr",update = F,ask = F)
if(!require(stringr))install.packages('stringr',update = F,ask = F)
if(!require(tibble))install.packages('tibble',update = F,ask = F)
library(tidyr)
library(dplyr)
library(stringr)
library(tibble)
更换电脑时重新运行代码,发现R版本过期了,tidyr包需要R4.1.3以上,更新后无报错。
专题1.数据框操作
order() 函数用于排序
准备一下样本数据
test <- iris[c(1:2,51:52,101:102),]    #根据行号抽取需要的数据
rownames(test) =NULL  #将行号变量清空
test
  Sepal.Length Sepal.Width Petal.Length Petal.Width    Species
1          5.1         3.5          1.4         0.2     setosa
2          4.9         3.0          1.4         0.2     setosa
3          7.0         3.2          4.7         1.4 versicolor
4          6.4         3.2          4.5         1.5 versicolor
5          6.3         3.3          6.0         2.5  virginica
6          5.8         2.7          5.1         1.9  virginica
order(test$Sepal.Length) #根据第一列排序
test[order(test$Sepal.Length),] #根据排序结果取出数据,升序
test[order(test$Sepal.Length,decreasing = T),]  降序
  Sepal.Length Sepal.Width Petal.Length Petal.Width    Species
2          4.9         3.0          1.4         0.2     setosa
1          5.1         3.5          1.4         0.2     setosa
6          5.8         2.7          5.1         1.9  virginica
5          6.3         3.3          6.0         2.5  virginica
4          6.4         3.2          4.5         1.5 versicolor
3          7.0         3.2          4.7         1.4 versicolor
arrange() 函数排序
普通排序
arrange(test,Sepal.Length) #升序
arrange(test,desc(Sepal.Length)) #降序
按照A列排序,如果A列相同,按照B列排序
arrange(test,Sepal.Length, Sepal.Width) #length为A列,Width为B列
mutate() 函数新增列
需重新定赋值原本变量,否则无改变
#两种方式赋值新的一列
test <- mutate(test,new= test$Sepal.Length* test$Sepal.Width)
test$new <- test$Sepal.Length* test$Sepal.Width
select() 和 filter() 筛选函数
优秀的管道符号
x1 = filter (iris,Sepal.Width >3)
x2 = select (x1,c("Sepal.Length","Sepal.Width"))
x3 = arrange(x2,Sepal.Length)
# 加入管道符号连接,理解为向后传递
x = iris %>%
   filter (Sepal.Width >3) %>%
   select (c("Sepal.Length","Sepal.Width")) %>%
   arrange(Sepal.Length)
专题2.表达矩阵画箱线图
生成一个固定不变的矩阵,做一些微调
set.seed(10086)
exp = matrix(rnorm(18),ncol = 6)
exp = round(exp,2)  # 取几位小数
rownames(exp) = paste0("gene",1:3)  #添加行名
colnames(exp) = paste0("test",1:6) #添加列名
exp[,1:3] = exp[,1:3]+1 #给前三列+1
exp
      test1 test2 test3 test4 test5 test6
gene1  1.55  1.49  1.80 -0.37 -1.82 -1.62
gene2 -1.74  0.37  2.08  2.11 -0.22  1.42
gene3  1.57  1.25  1.32  2.49  0.58 -0.81
library(tidyr)
library(tibble)
library(dplyr)
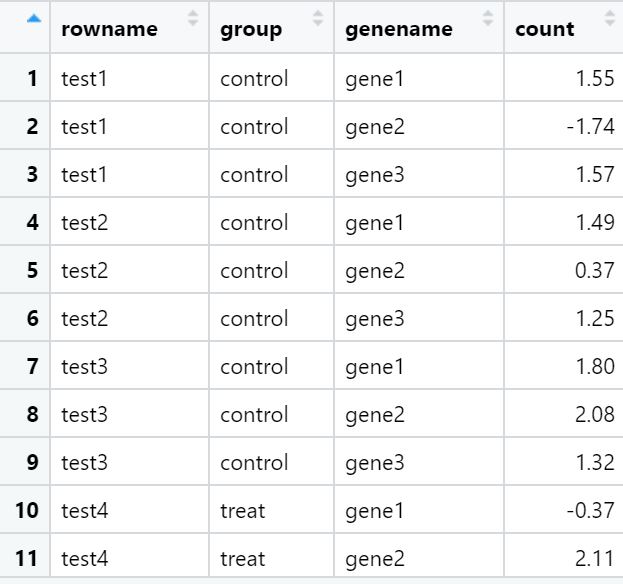
dat = t(exp) %>%
as.data.frame() %>%
rownames_to_column() %>%
mutate(group = rep(c("control","treat"),each = 3))
#增长
pdat = dat %>%
pivot_longer(cols = starts_with("gene")
names_to = "gene",
values_to = "count")
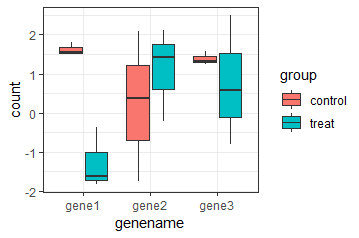
library(ggplot2)
p = ggplot(pdat,aes(gene,count))+
  geom_boxplot(aes(fill = group))+
  theme_bw()
p + facet_wrap(~gene,scales = "free")
专题3.连接
library(dplyr)
inner_join(test1,test2,by="name")
right_join(test1,test2,by="name")
full_join(test1,test2,by="name")  #全连接,取全集
semi_join(test1,test2,by="name")
anti_join(test1,test2,by="name")