ggplot几何对象
几何对象可以叠加
ggplot(data = iris) +
geom_smooth(mapping = aes(x = Sepal.Length,
y = Petal.Length))+
geom_point(mapping = aes(x = Sepal.Length,
y = Petal.Length))
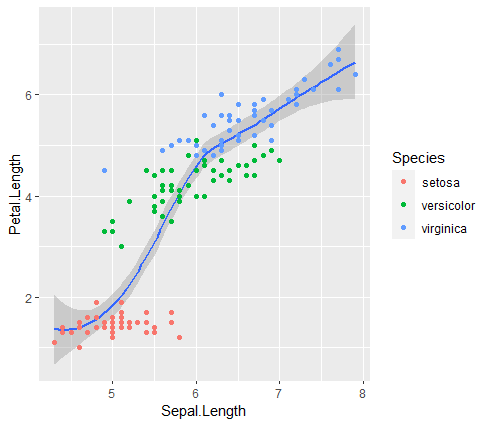
#全局描述方法
ggplot(data = iris,mapping = aes(x = Sepal.Length, y = Petal.Length))+
geom_smooth()+
geom_point(mapping = aes (color= Species)) #单独赋值不一样的变量
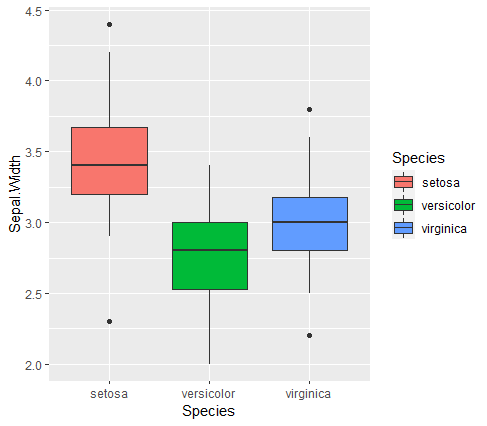
小作业
绘制箱线图,并区分颜色
ggplot(data = iris,mapping = aes(x = Species, y = Sepal.Width))+
  geom_boxplot(mapping = aes(fill = Species)) #这里用fill是将颜色填充进去
统计变换
fre = as.data.frame(table(diamonds$cut))
fre
#不统计,数据直接做图
ggplot(data = fre) +
  geom_bar(mapping = aes(x = Var1, y = Freq), stat = "identity")

#count改为prop
ggplot(data = diamonds) +
  geom_bar(mapping = aes(x = cut, y = ..prop.., group = 1))
位置关系
点图不重叠 jitter()
ggplot(data = iris,mapping = aes(x = Species, y = Sepal.Width))+
  geom_boxplot(mapping = aes(fill = Species))+
  geom_jitter()

堆叠直方图
ggplot(data = diamonds) +
  geom_bar(mapping = aes(x = cut,fill=clarity))

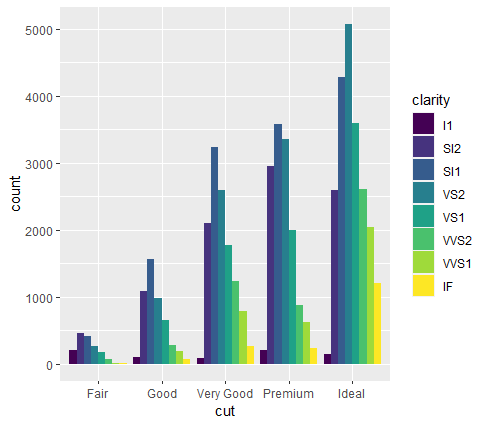
并列直方图
ggplot(data = diamonds) +
  geom_bar(mapping = aes(x = cut, fill = clarity), position = "dodge")
坐标系
#横纵坐标颠倒 coord_flip()
ggplot(data = mpg, mapping = aes(x = class, y = hwy)) +
geom_boxplot() +
coord_flip()
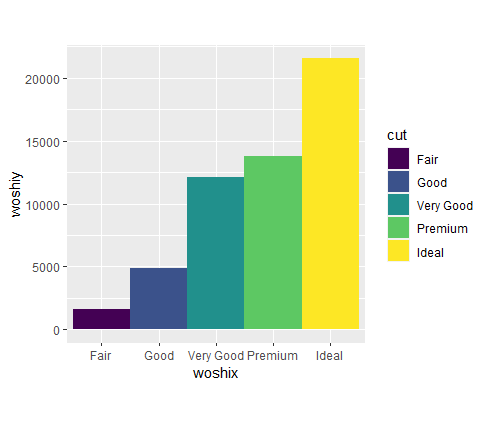
#主题、极坐标系
bar <- ggplot(data = diamonds) +
geom_bar(
mapping = aes(x = cut, fill = cut),
width = 1
) +
theme(aspect.ratio = 1) + #主题及宽高比
labs(x = NULL, y = NULL) #坐标名称
bar #此处加入了主题
bar + coord_flip() #颠倒
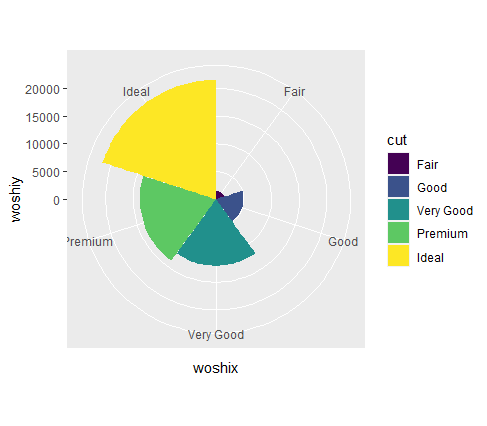
bar + coord_polar() #极坐标
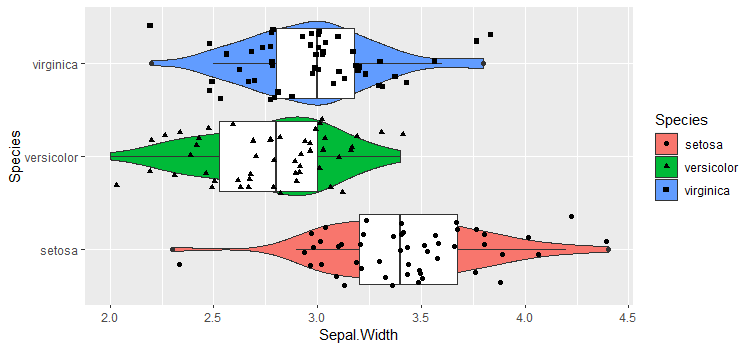
课后作业
ggplot(data = iris, aes(x = Species, y = Sepal.Width))+
  geom_violin(aes(fill = Species))+
  geom_boxplot()+
  geom_jitter(aes(shape = Species))+
  coord_flip()