ggpubr的应用
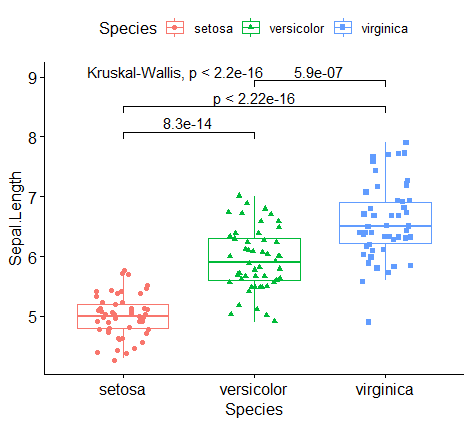
举例-箱线图中加入统计计算
library(ggpubr)
ggscatter(iris,x="Sepal.Length",
          y="Petal.Length",
          color="Species")

p <- ggboxplot(iris, x = "Species",
               y = "Sepal.Length",
               color = "Species",
               shape = "Species",
               add = "jitter")
p
my_comparisons <- list( c("setosa", "versicolor"),
                        c("setosa", "virginica"),
                        c("versicolor", "virginica") )
p + stat_compare_means(comparisons = my_comparisons)+ # Add pairwise comparisons p-value
  stat_compare_means(label.y = 9)
STHDA网站上也有丰富的绘图样本及代码
图片保存
#ggplot2 保存方法
ggsave(p,filename = "iris_box_ggpubr.png")

#三段保存
pdf("x.pdf")
boxplot(iris[,1]~iris[,5])
text(6.5,4, labels = 'hello')
dev.off()  #关闭画板

#eoffice包
library(eoffice)
topptx(p,"iris_box_ggpubr.pptx")
图片拼接–patchwork
library(ggplot2)
library(patchwork)
p1 <- ggplot(mpg) +
  geom_point(aes(hwy, displ))
p2 <- ggplot(mpg) +
  geom_bar(aes(manufacturer, fill = stat(count))) +
  coord_flip()
p1 + p2
p1 / p2